
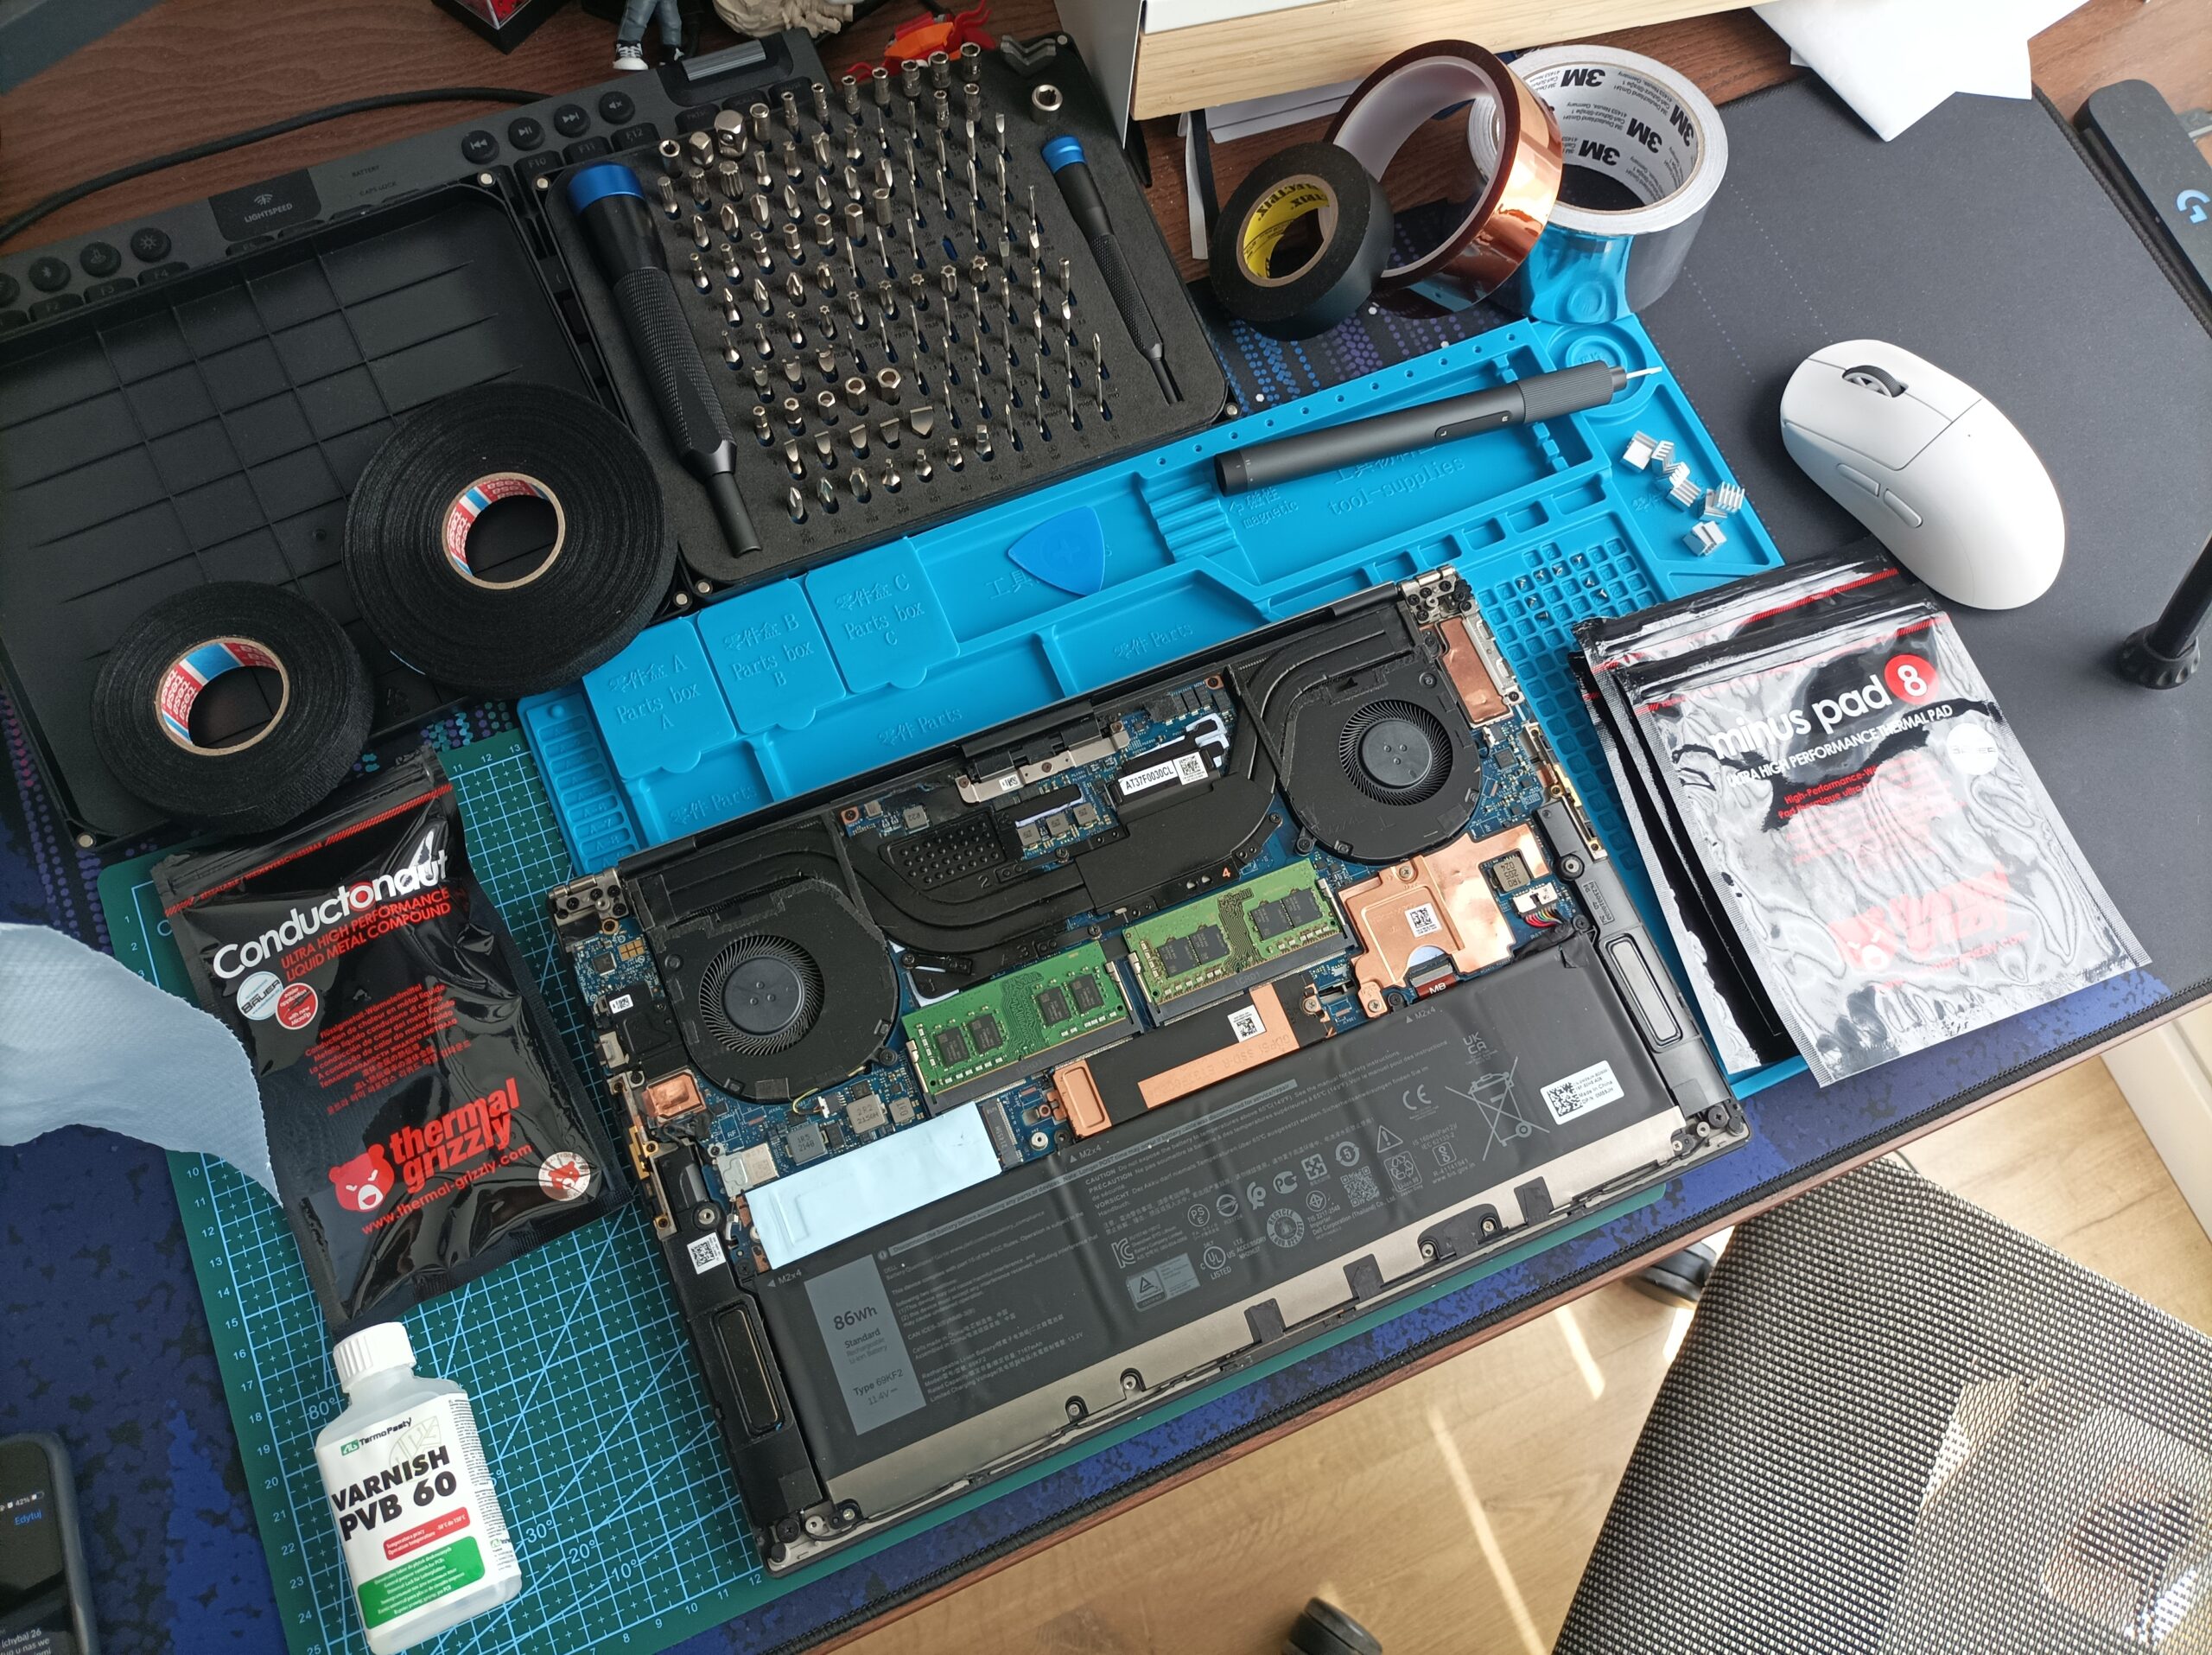
Link to pretty comparison grapghs
Summary Table
Title
Before @ 22-24c ambient
Graph
After @ 23c ambient
Graph
Idle
71°C CPU

53°C CPU

Baldurs Gate 3 1080p
80,4°C CPU
67,2°C GPU



67°C CPU
64°C GPU

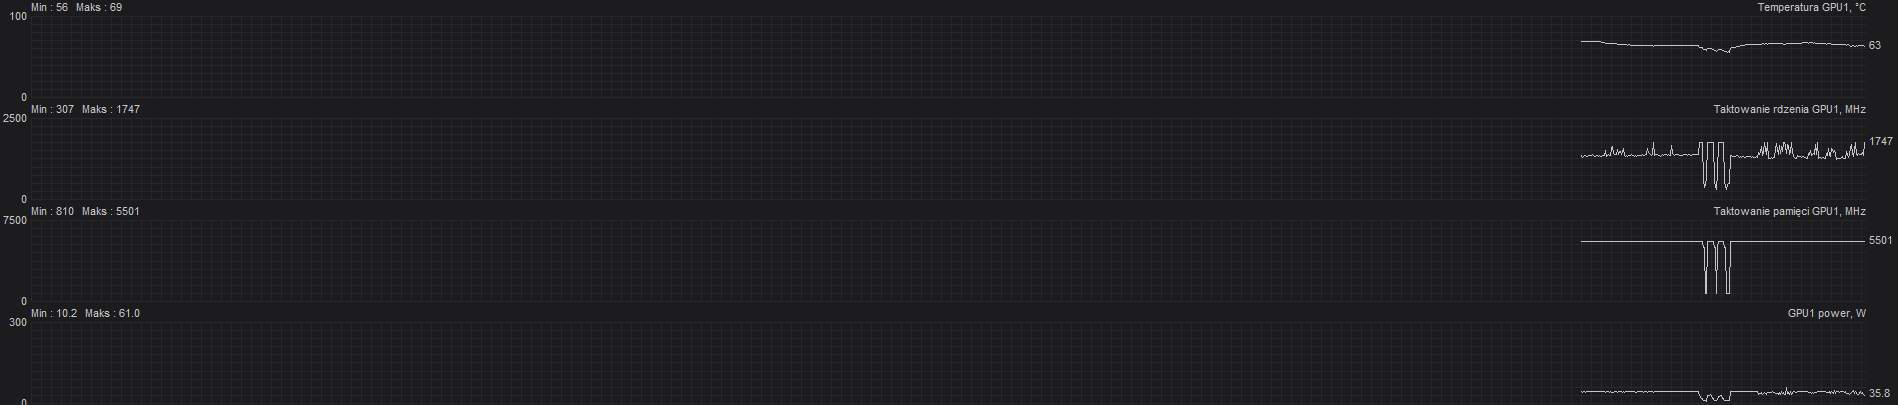
Baldus Gate 3 4k
80,2°C CPU
66,7°C GPU



71°C CPU
65°C GPU

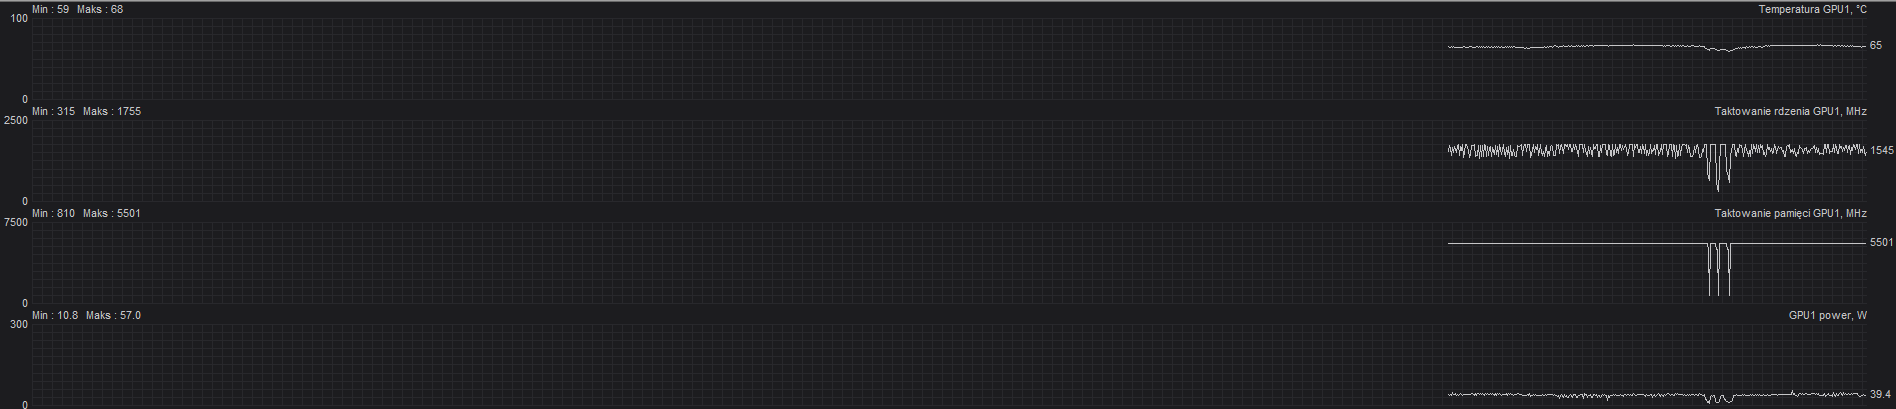
Google Chrome 1080p
73°C CPU

51°C CPU
46°C GPU

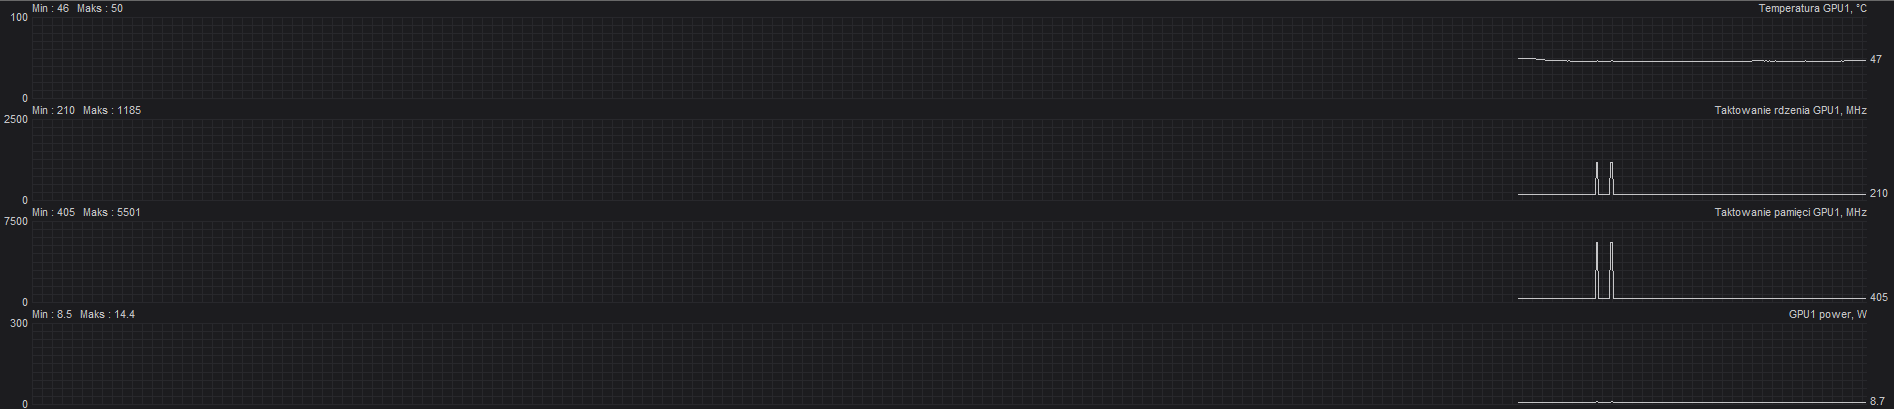
Google Chrome 4k
60°C CPU

51°C CPU
46°C GPU

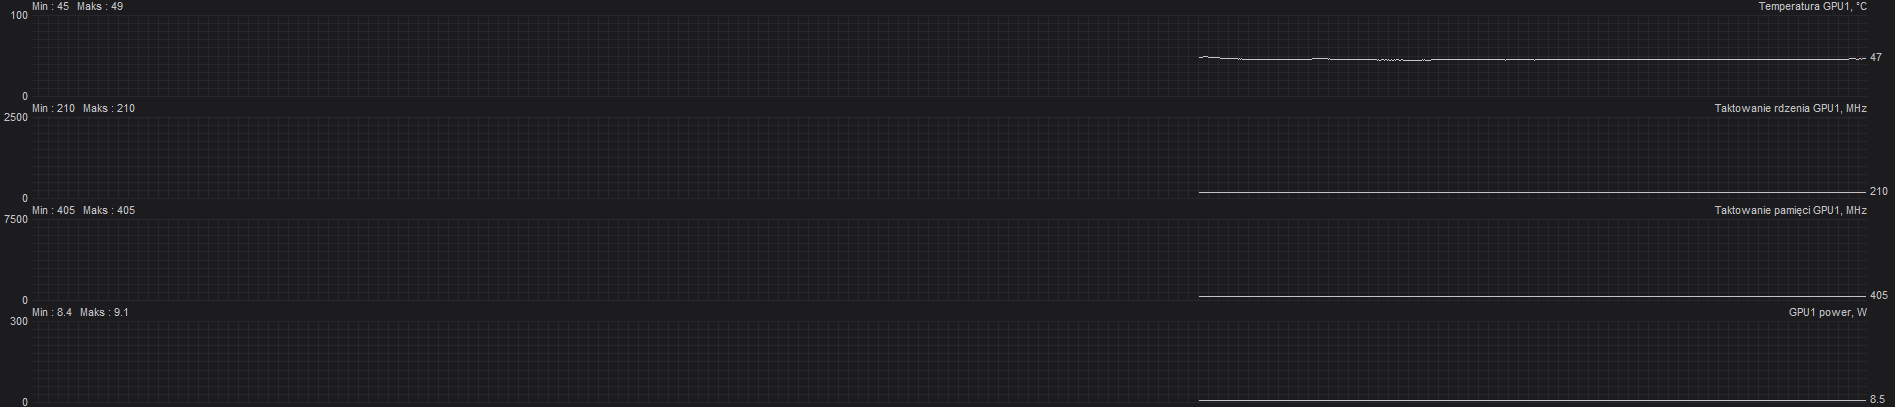
Cinebench Single Core
92,2°C CPU
57,3°C GPU

66°C CPU
50°C GPU

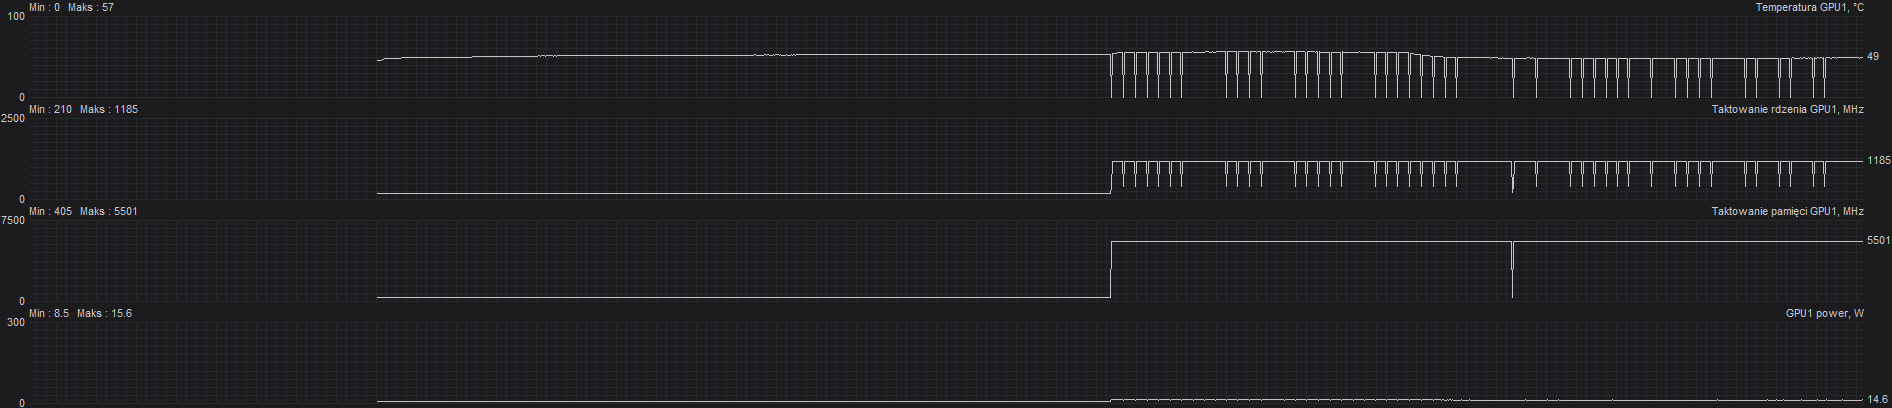
Cinebench Multi Core
91,6°C CPU
63,1°C GPU

73°C CPU
60°C GPU

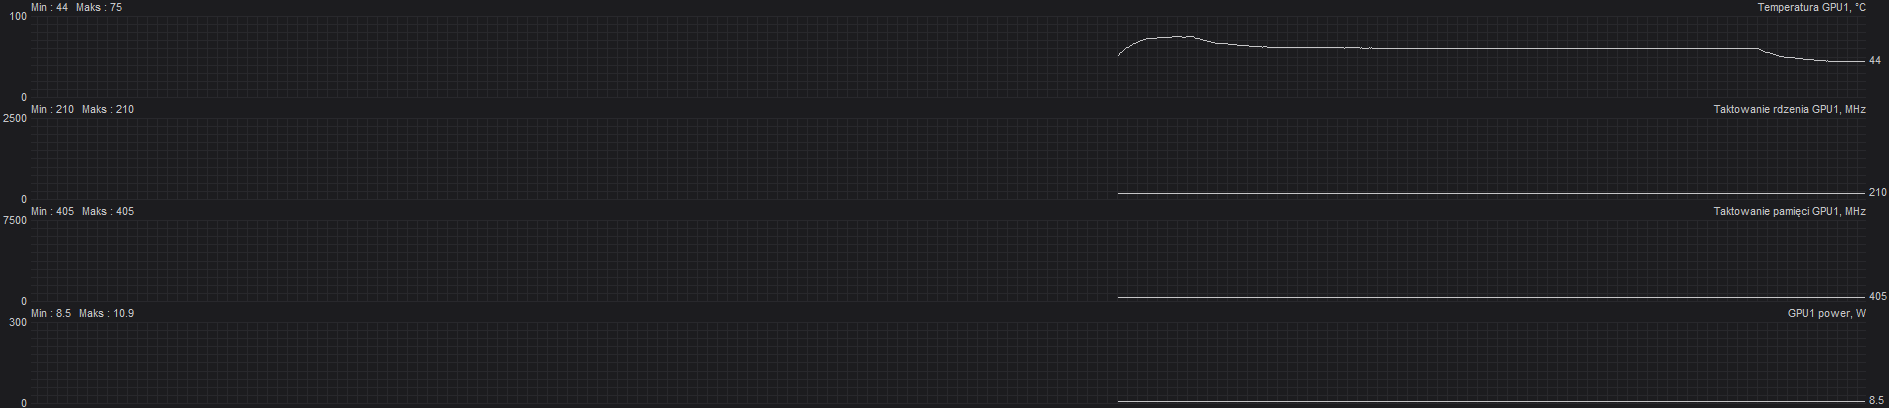
3D Mark Timespy 1080p
75,6°C CPU
61,6°C GPU



70°C CPU
64°C GPU

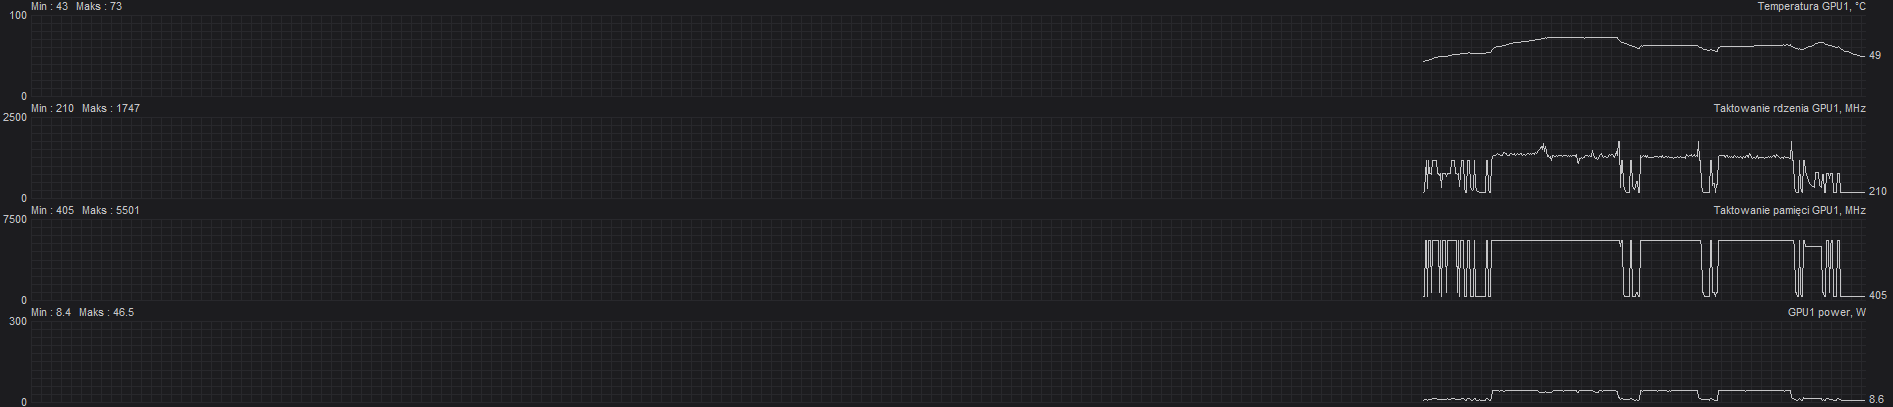
3D Mark Timespy 4k
79,5°C CPU
64,8°C GPU



70°C CPU
61°C GPU

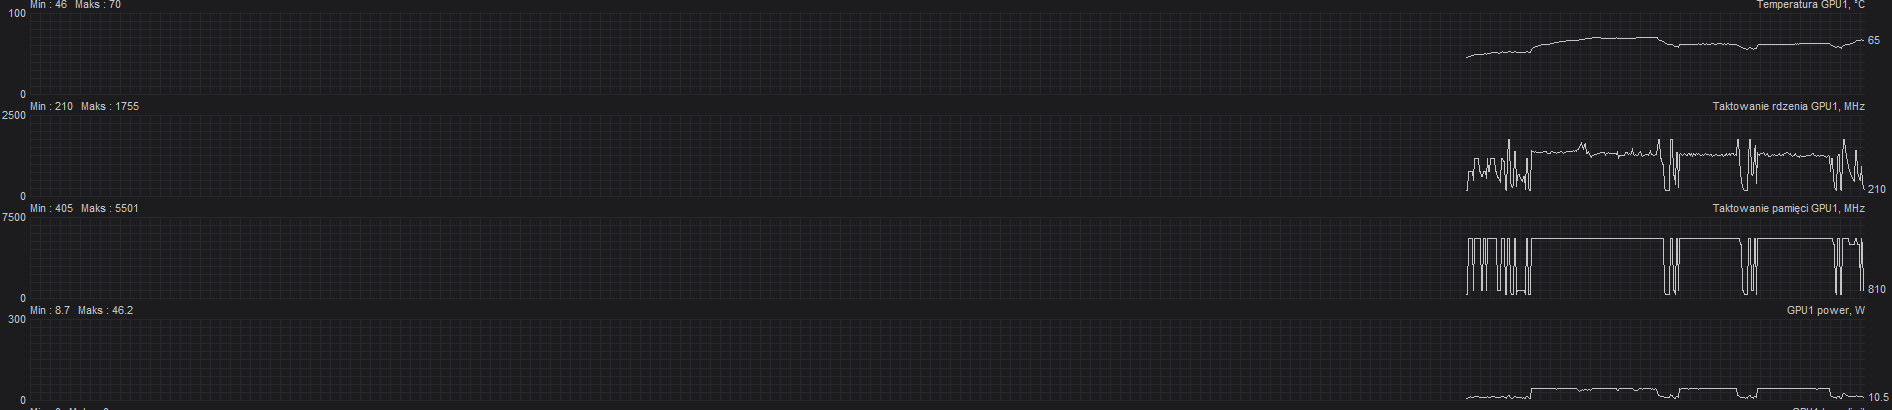
Results from benchmarking Thermal Grizzly Kryonaut vs Thermal Grizzly Conductonaut
Graph order
- CPU temp °C
- CPU clock MHz
- CPU power W
- GPU temp °C
- GPU core clock MHz
- GPU memory clock MHz
- GPU power W
3D Mark Benchmark Results
Before
After
4 741 Time Spy @ 1920×1200 desktop resolution
https://www.3dmark.com/spy/41437423
4 893 Time Spy @ 1920×1200 desktop resolution
https://www.3dmark.com/spy/41456573
4 705 Time Spy @ 3456 × 2160 desktop resolution
https://www.3dmark.com/spy/41437649
4 840 Time Spy @ 3456×2160 desktop resolution
http://www.3dmark.com/spy/41458612
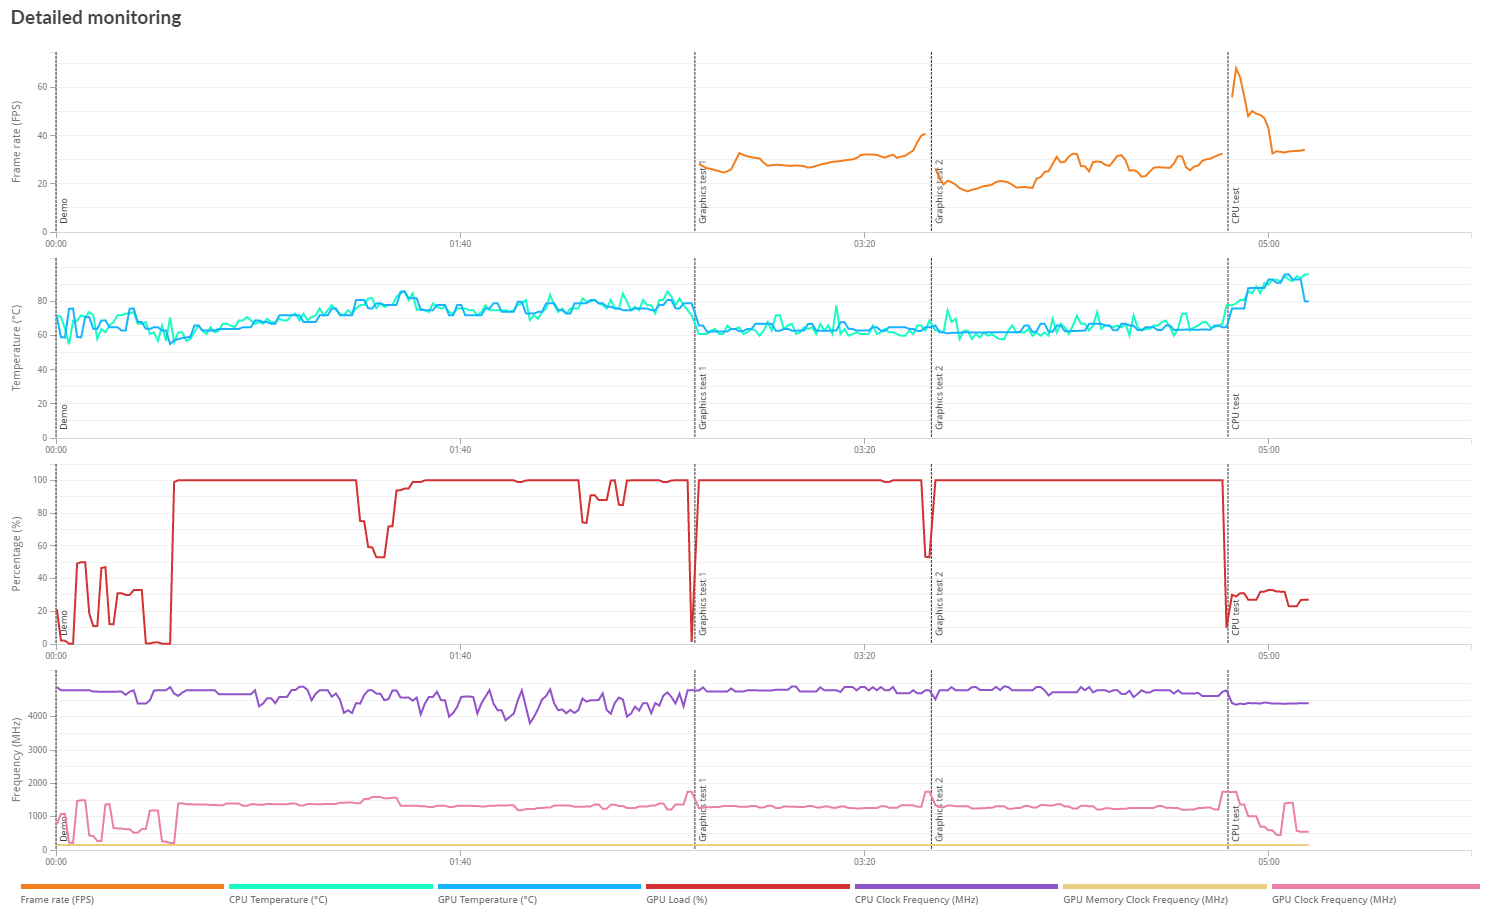
Monitoring screen from detailed 3D Mark run #41458612
Parameters Comparison in Baldurs Gate 3
Resolution
1920×1200
Max
Min
Avg
3456×2160
Max
Min
Avg
Before
80,2°C CPU
66,7°C GPU
714.9 FPS
1.2 FPS
56.3 FPS
80,2°C CPU
66,7°C GPU
345.1 FPS
0.7 FPS
20.9 FPS
After
67°C CPU
64°C GPU
687.5 FPS
0.8 FPS
53.9 FPS
71°C CPU
65°C GPU
414.9 FPS
1.7 FPS
17.4 FPS
Baldur Re-testing
Results right after liquid metal were strange. Temps were down as well as avg performance. Max and Min were higher but overall FPS dropped. It may be because of different benchmark timing. Before, I launched all data recordings in menu while after – when game loaded into the Gauntlet of Shar so there was no in menu 120 or 60 fps for minute or so. That’s why I did it again and will compare data from videocapture.
Afterburner graphs
CPU

Framerate Avg

GPU

Lost temp sensor for some reason….
Afterburner Benchmark
08-09-2023, 11:12:25 bg3.exe benchmark completed, 17237 frames rendered in 358.235 s
Average framerate : 48.1 FPS
Minimum framerate : 0.2 FPS
Maximum framerate : 683.8 FPS
1% low framerate : 0.2 FPS
0.1% low framerate : 0.2 FPS
Conclusions
I even changed nVidia drivers from Studio to Game Ready to give it another chance but with no success. It behaved similarly – temps went down as well as avg. FPS but Max and Low both were higher. What disturbs me even more are 3D Mark scores. They were better after the mods…. I know it’s not a gaming laptop but this behaviour does not make any sense to me. It’s bette but also worse? To make things clear, below are screenshots from game capture at 1920×1200 before and after. I’m not touching 4k because change from 7 to 9 FPS is….not reliable, let’s say. ;d
Before
After
Change
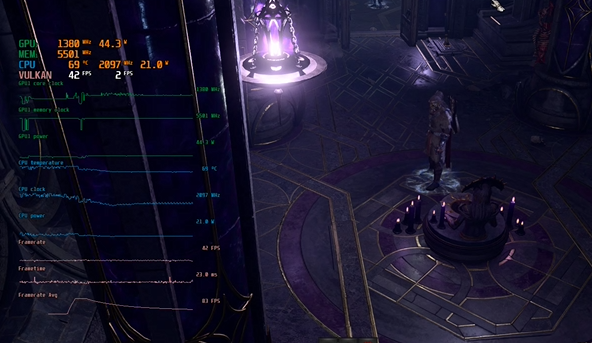
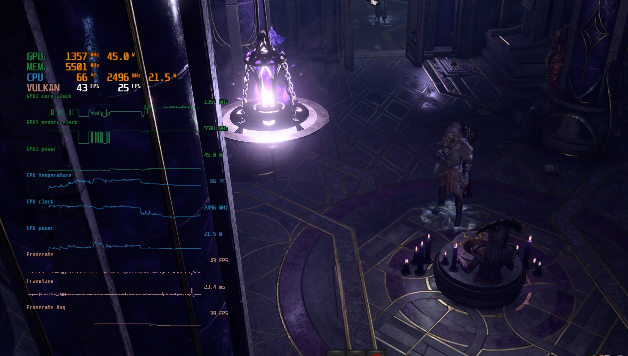
-3°C +0,5W CPU
framerate from avg(40,79)FPS to avg(39,94)FPS
Going out of the room, looking far away, lighting fire and going to the crystal. All before loading to forest.

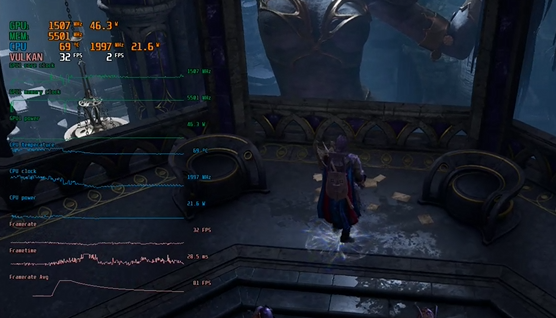
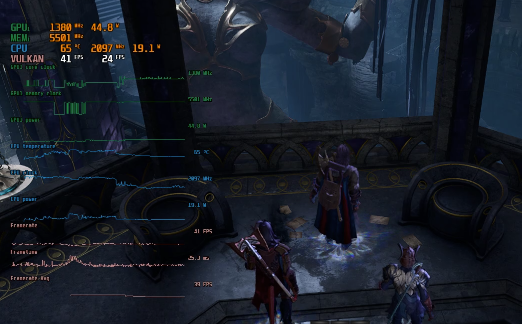
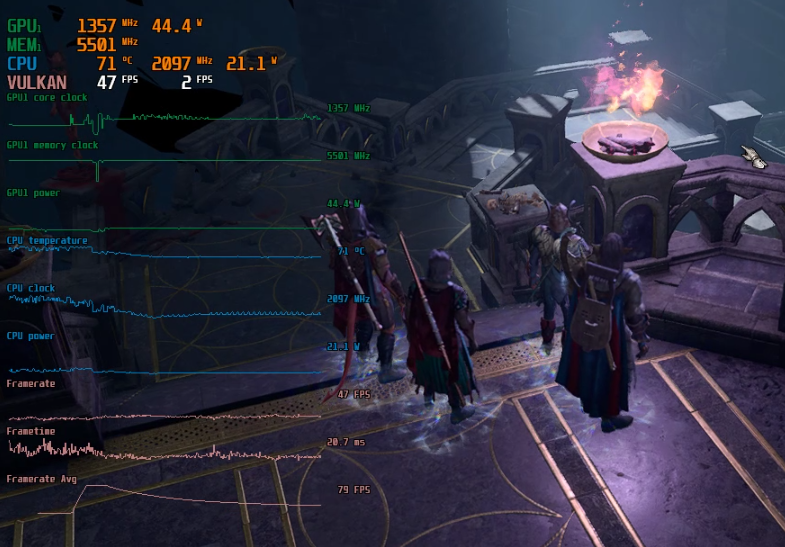
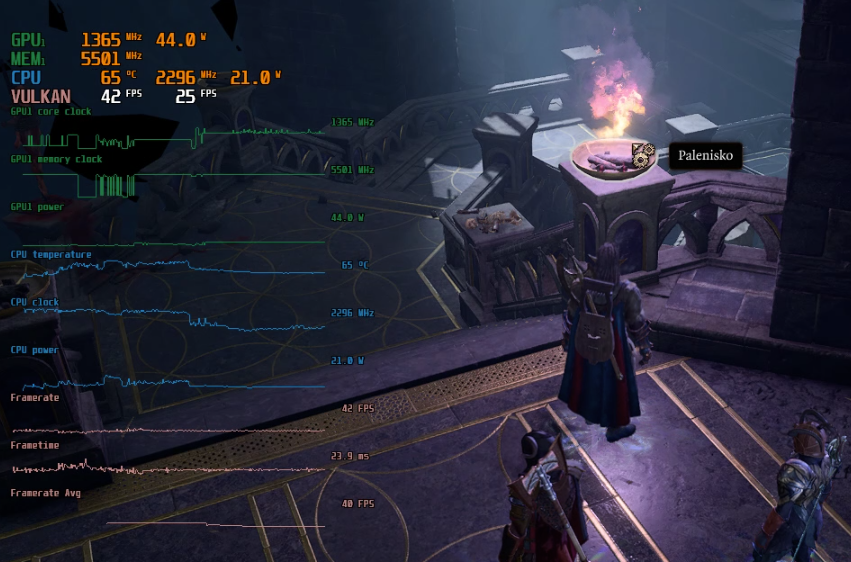
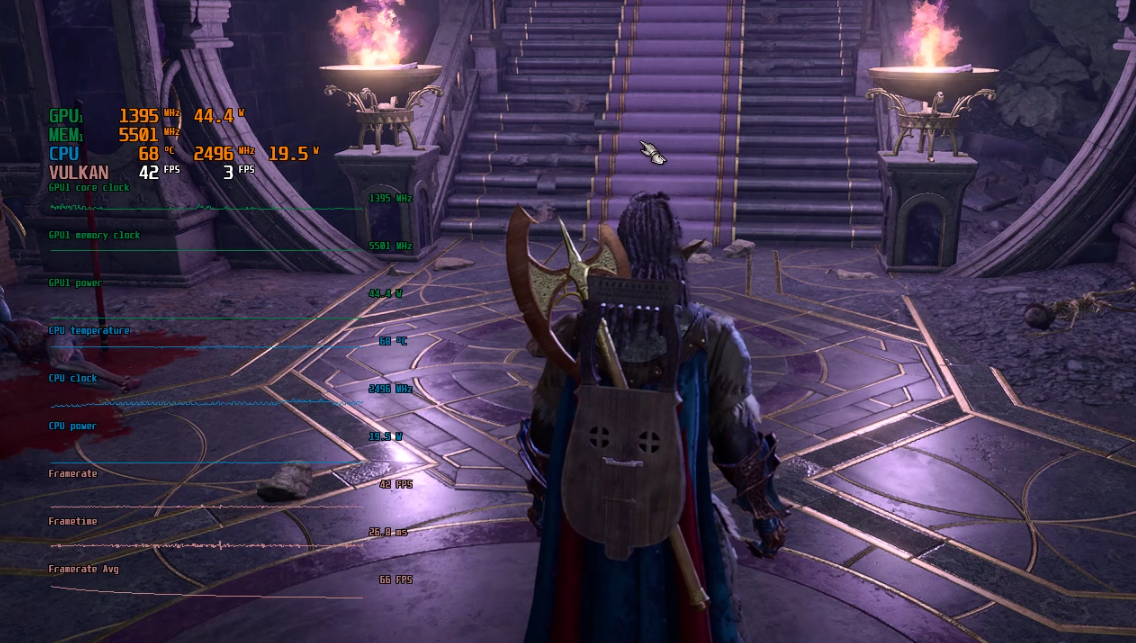

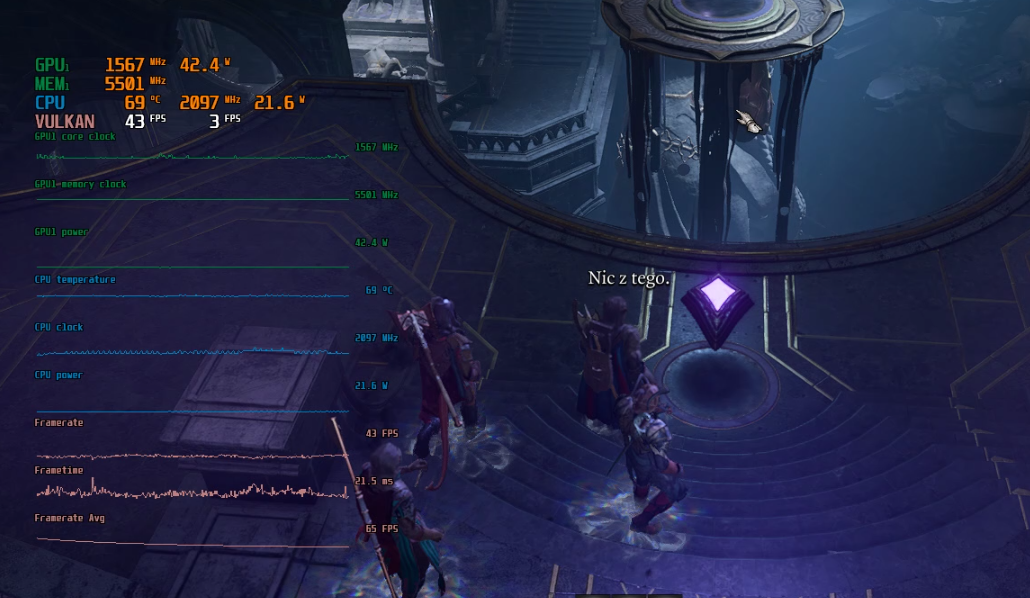
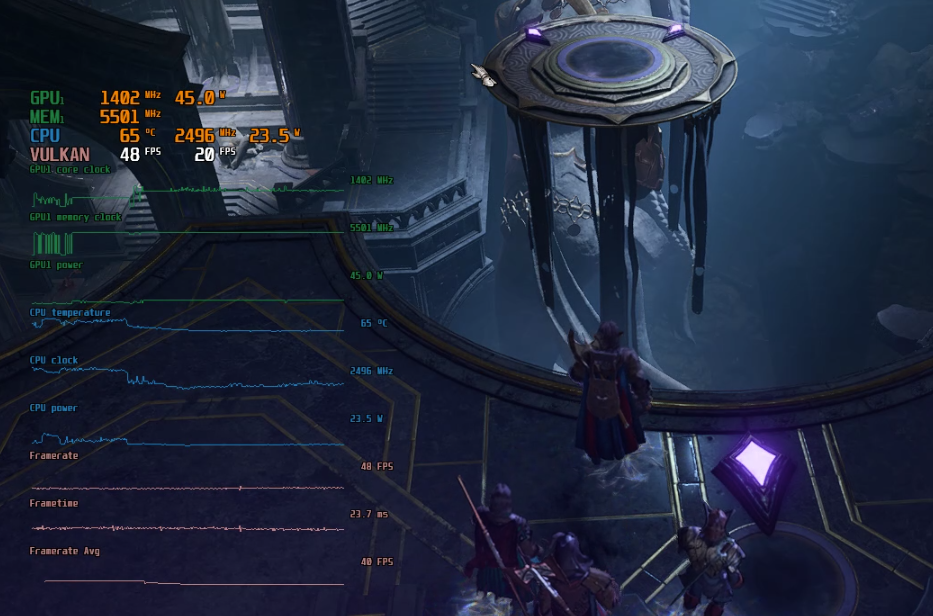
I leave these results to your judgement.
Below you can find some more photos from testing phase.
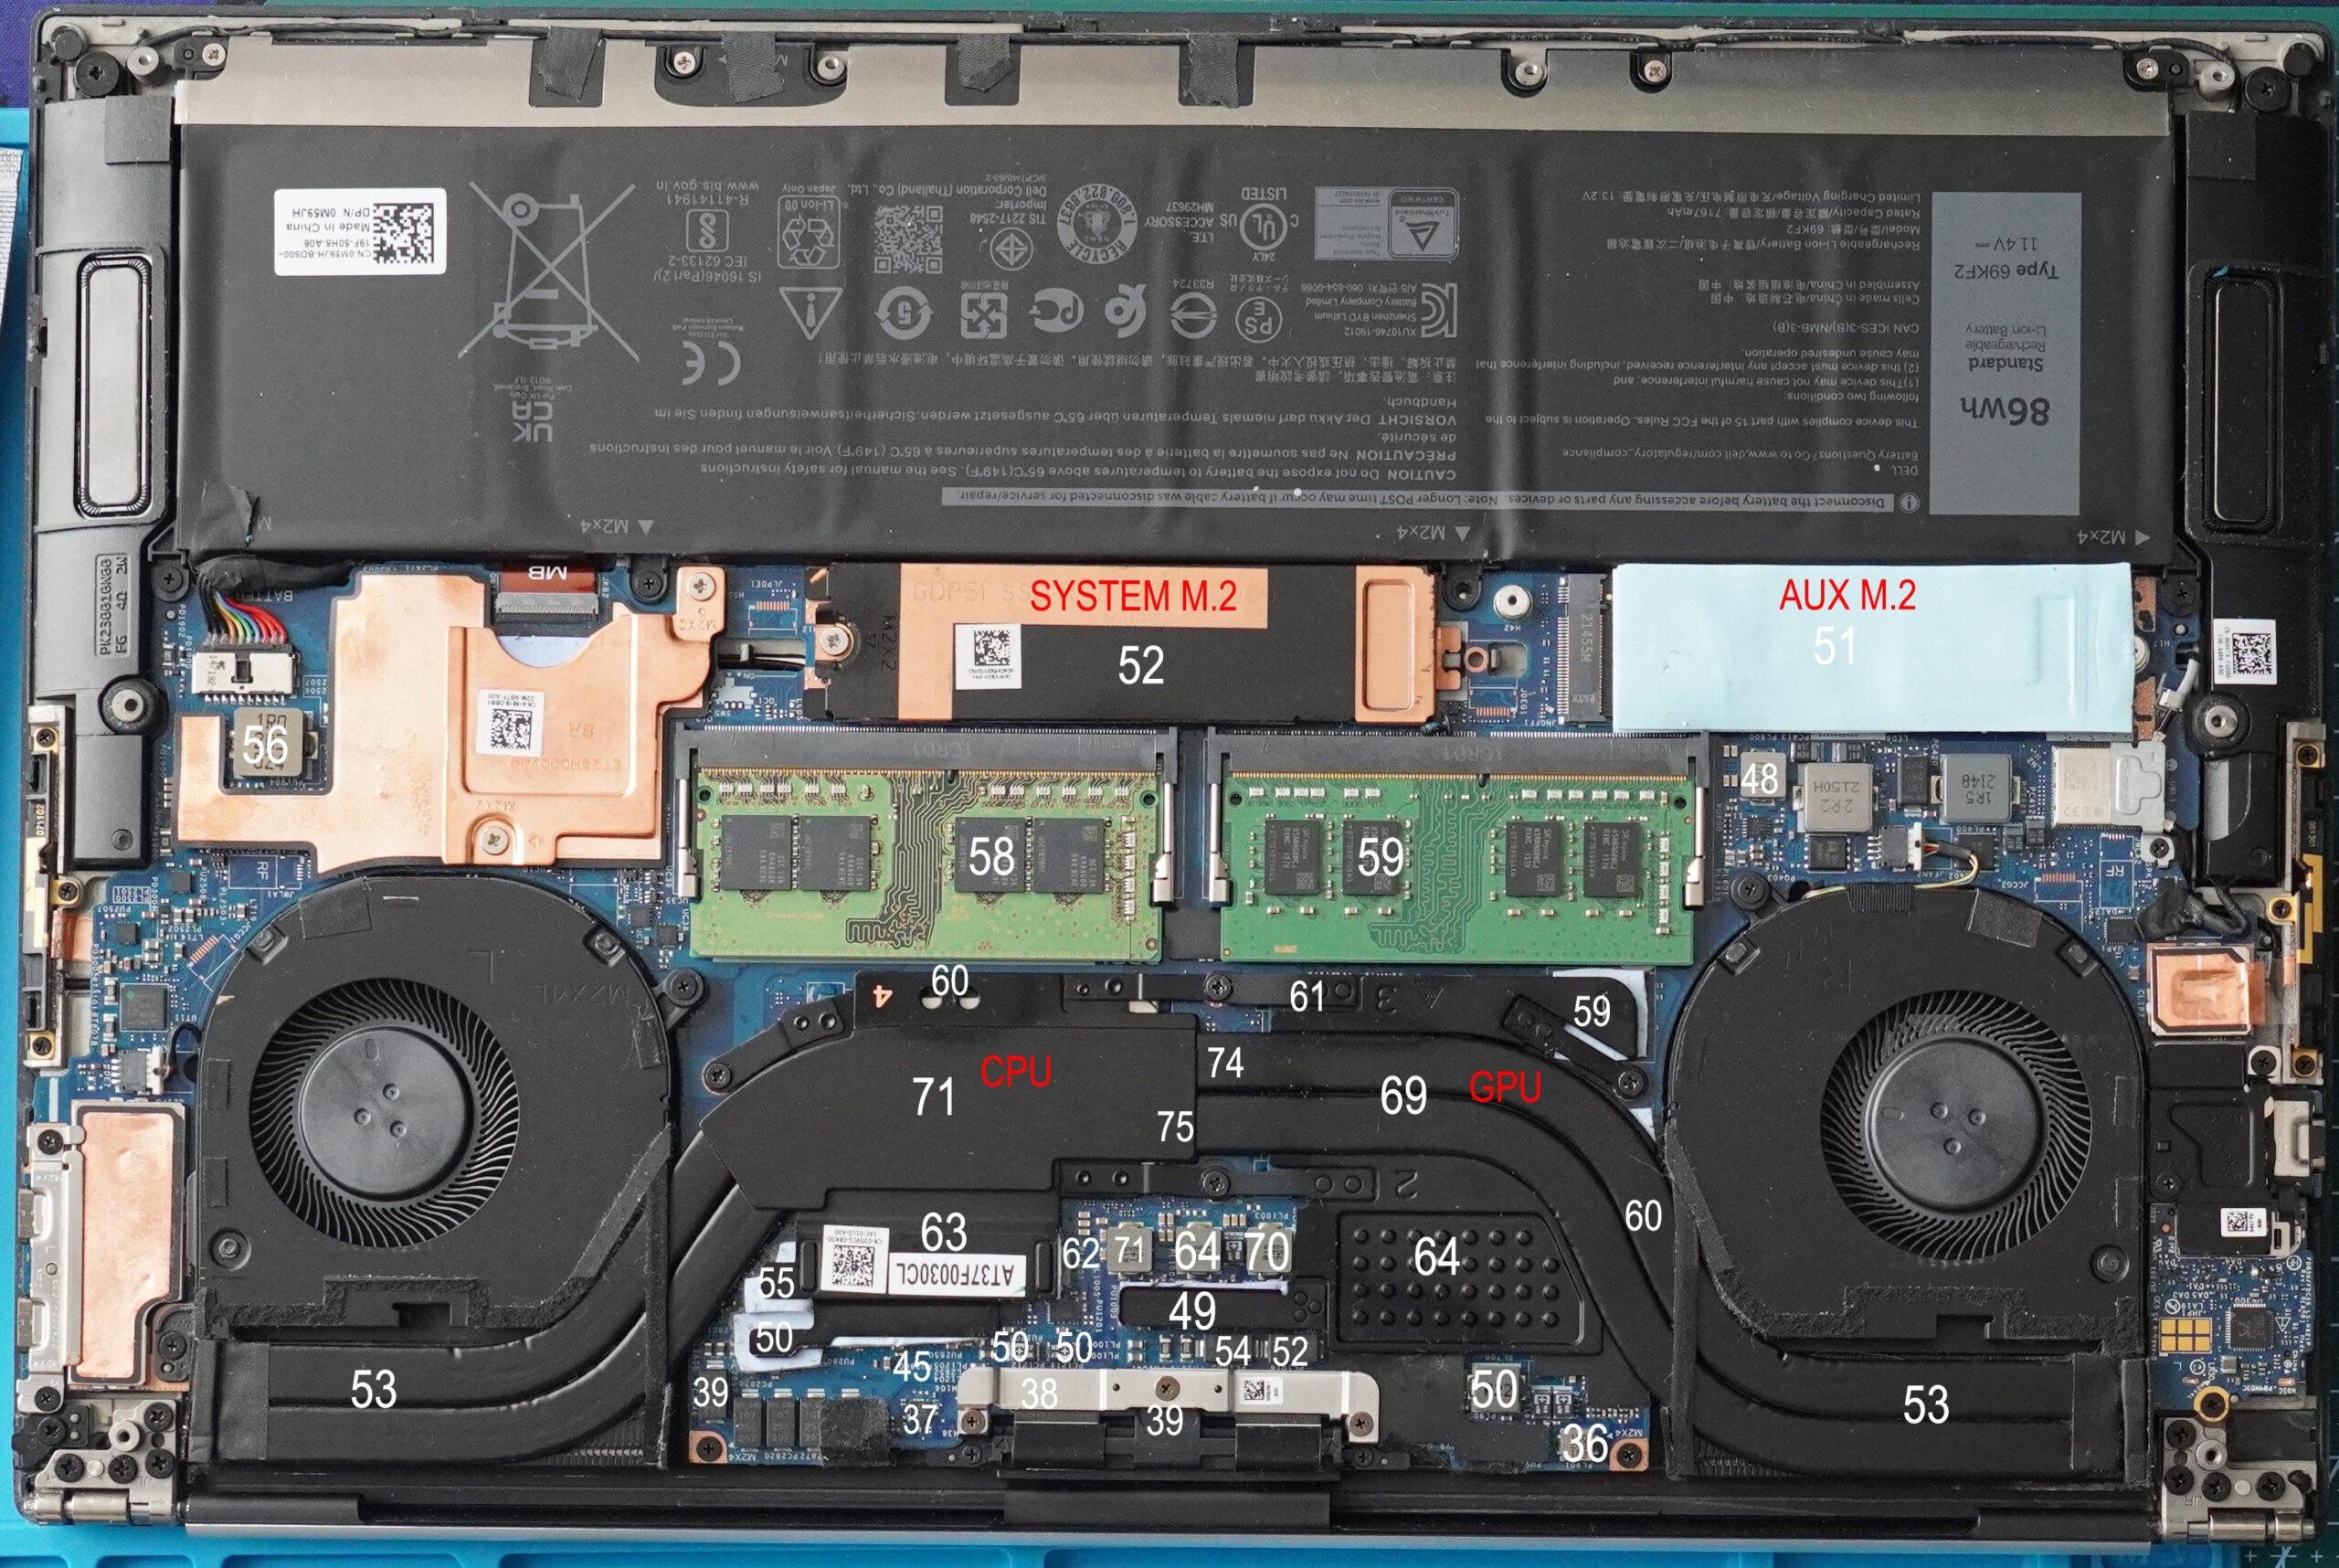
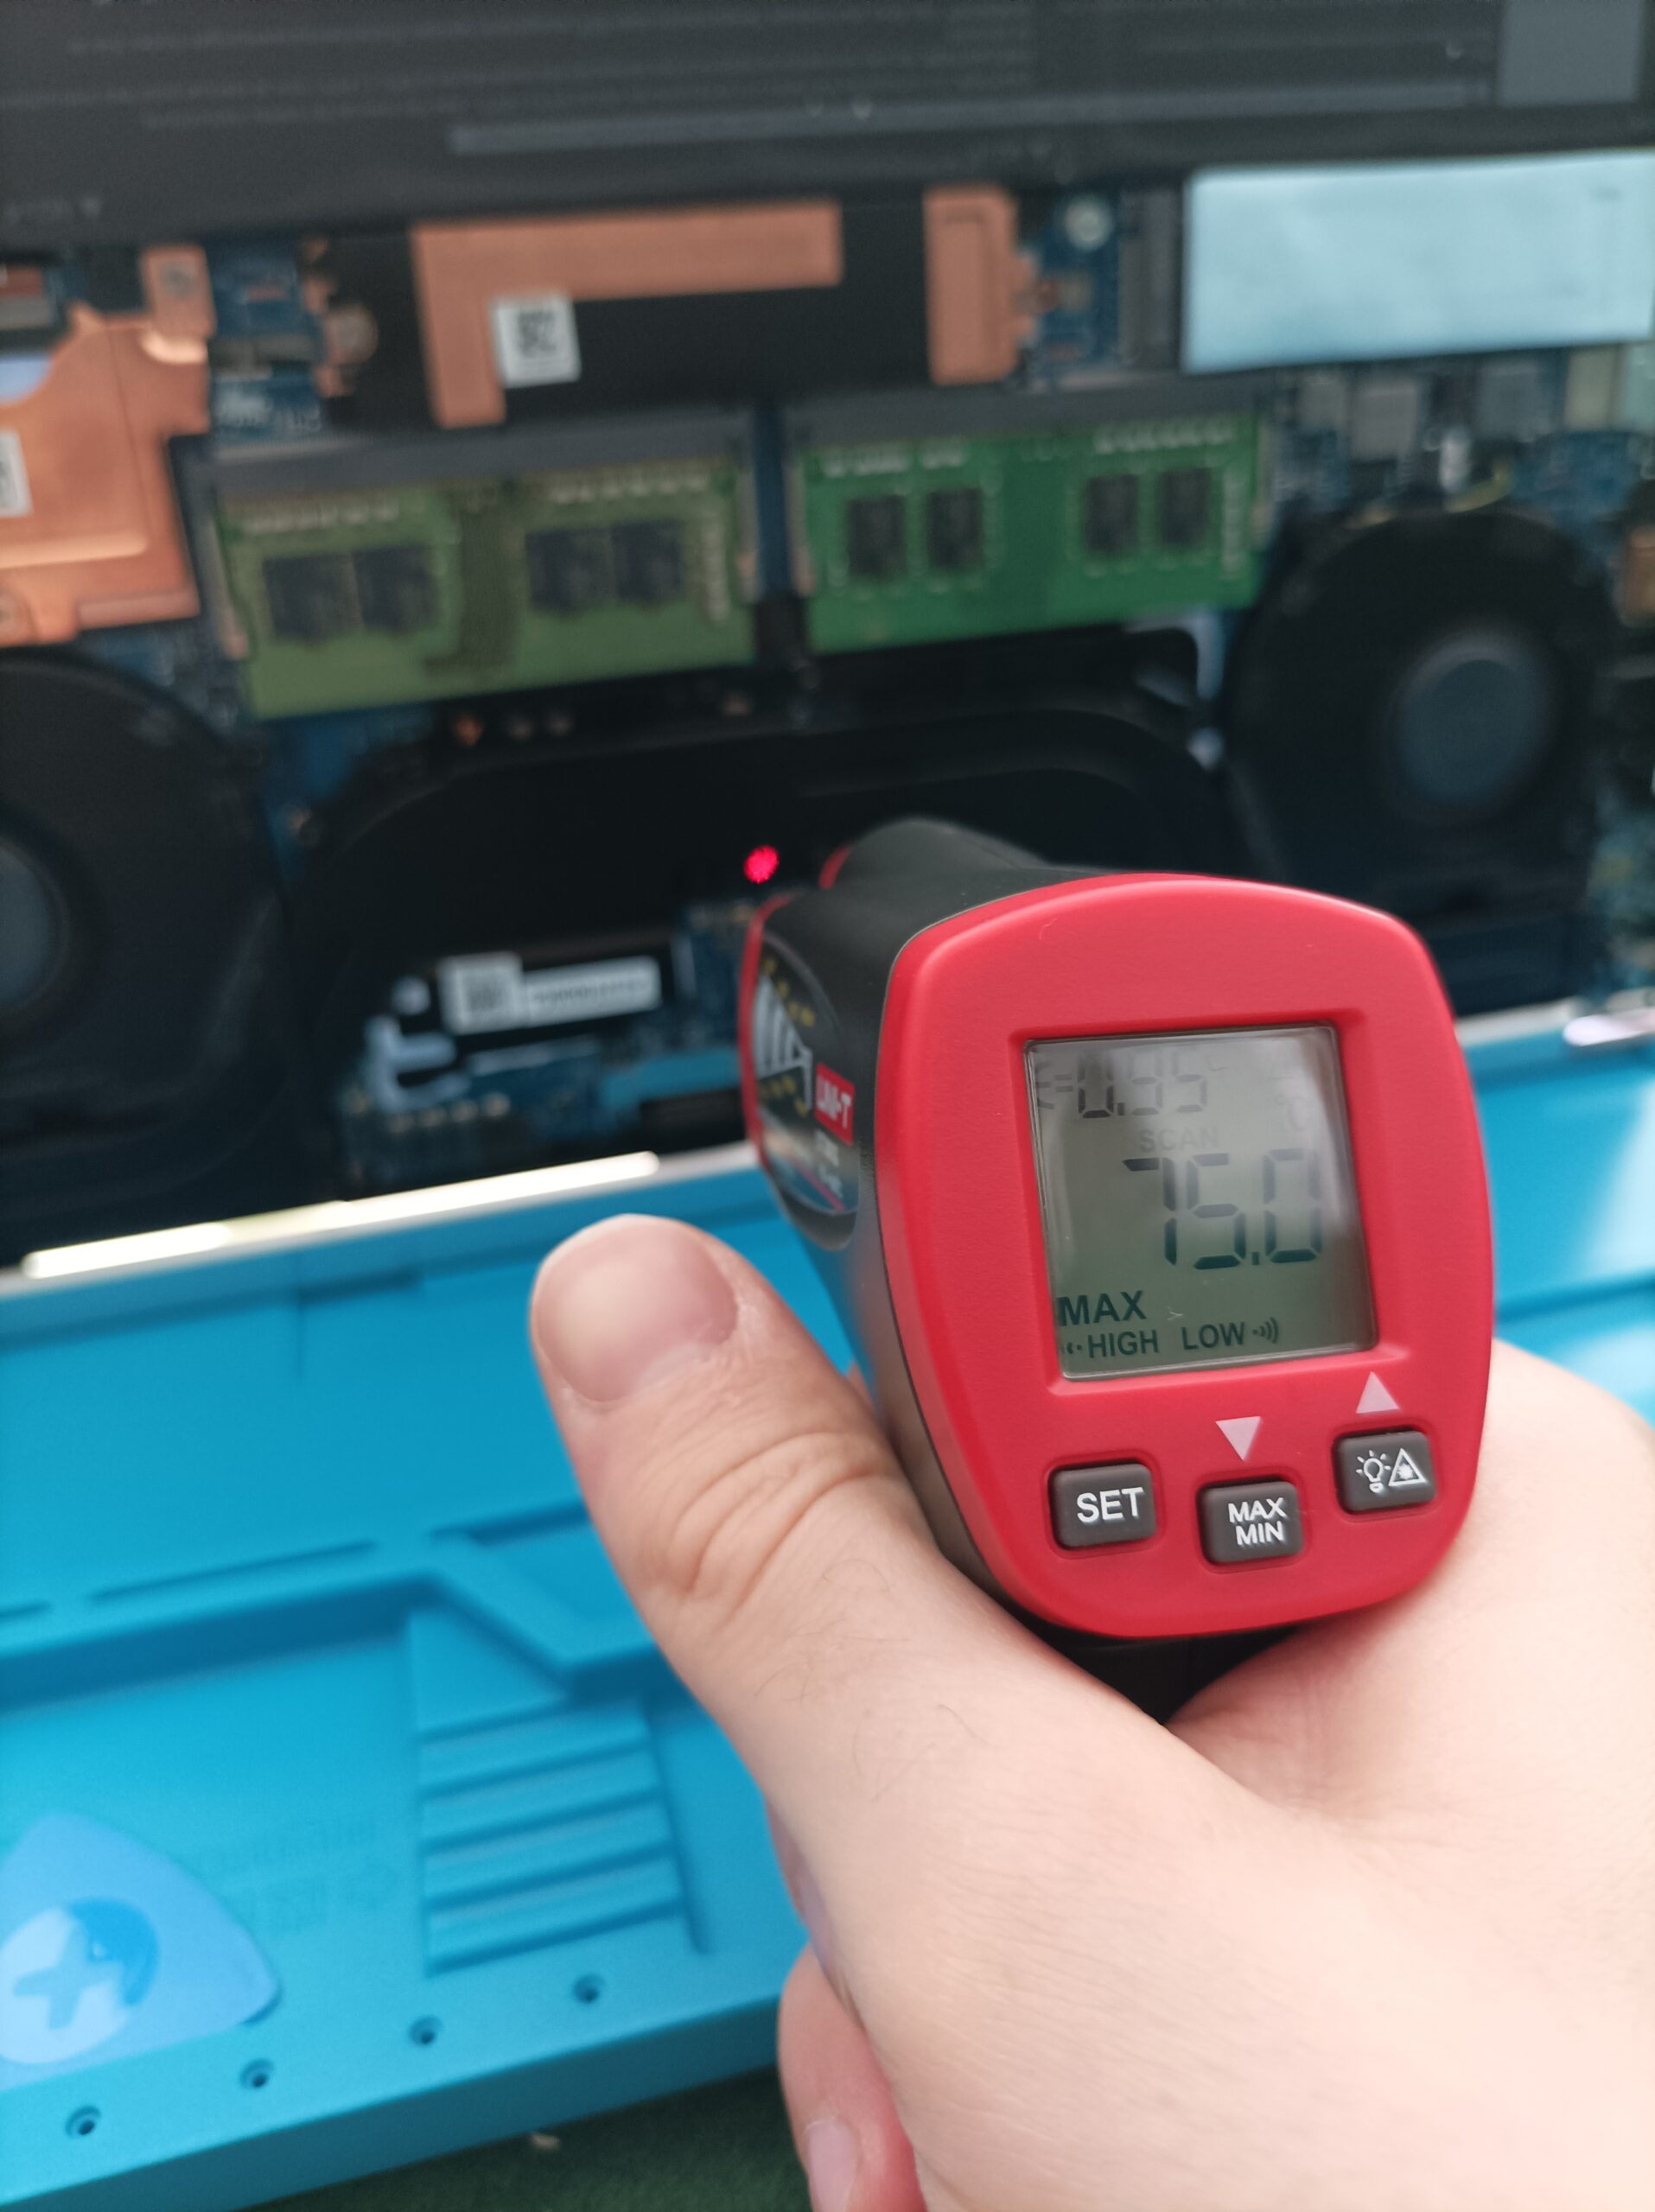
Motherboard temps (hotspot measurement)
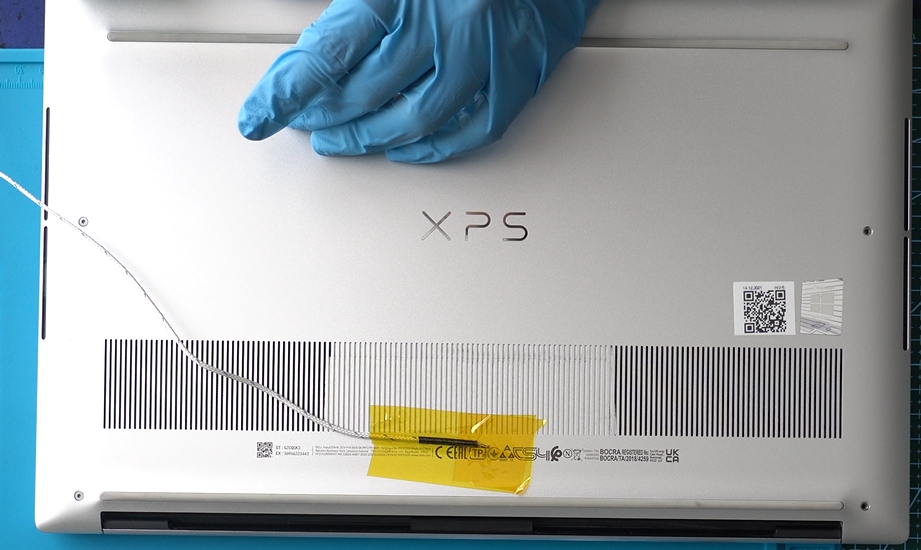
External thermocouples
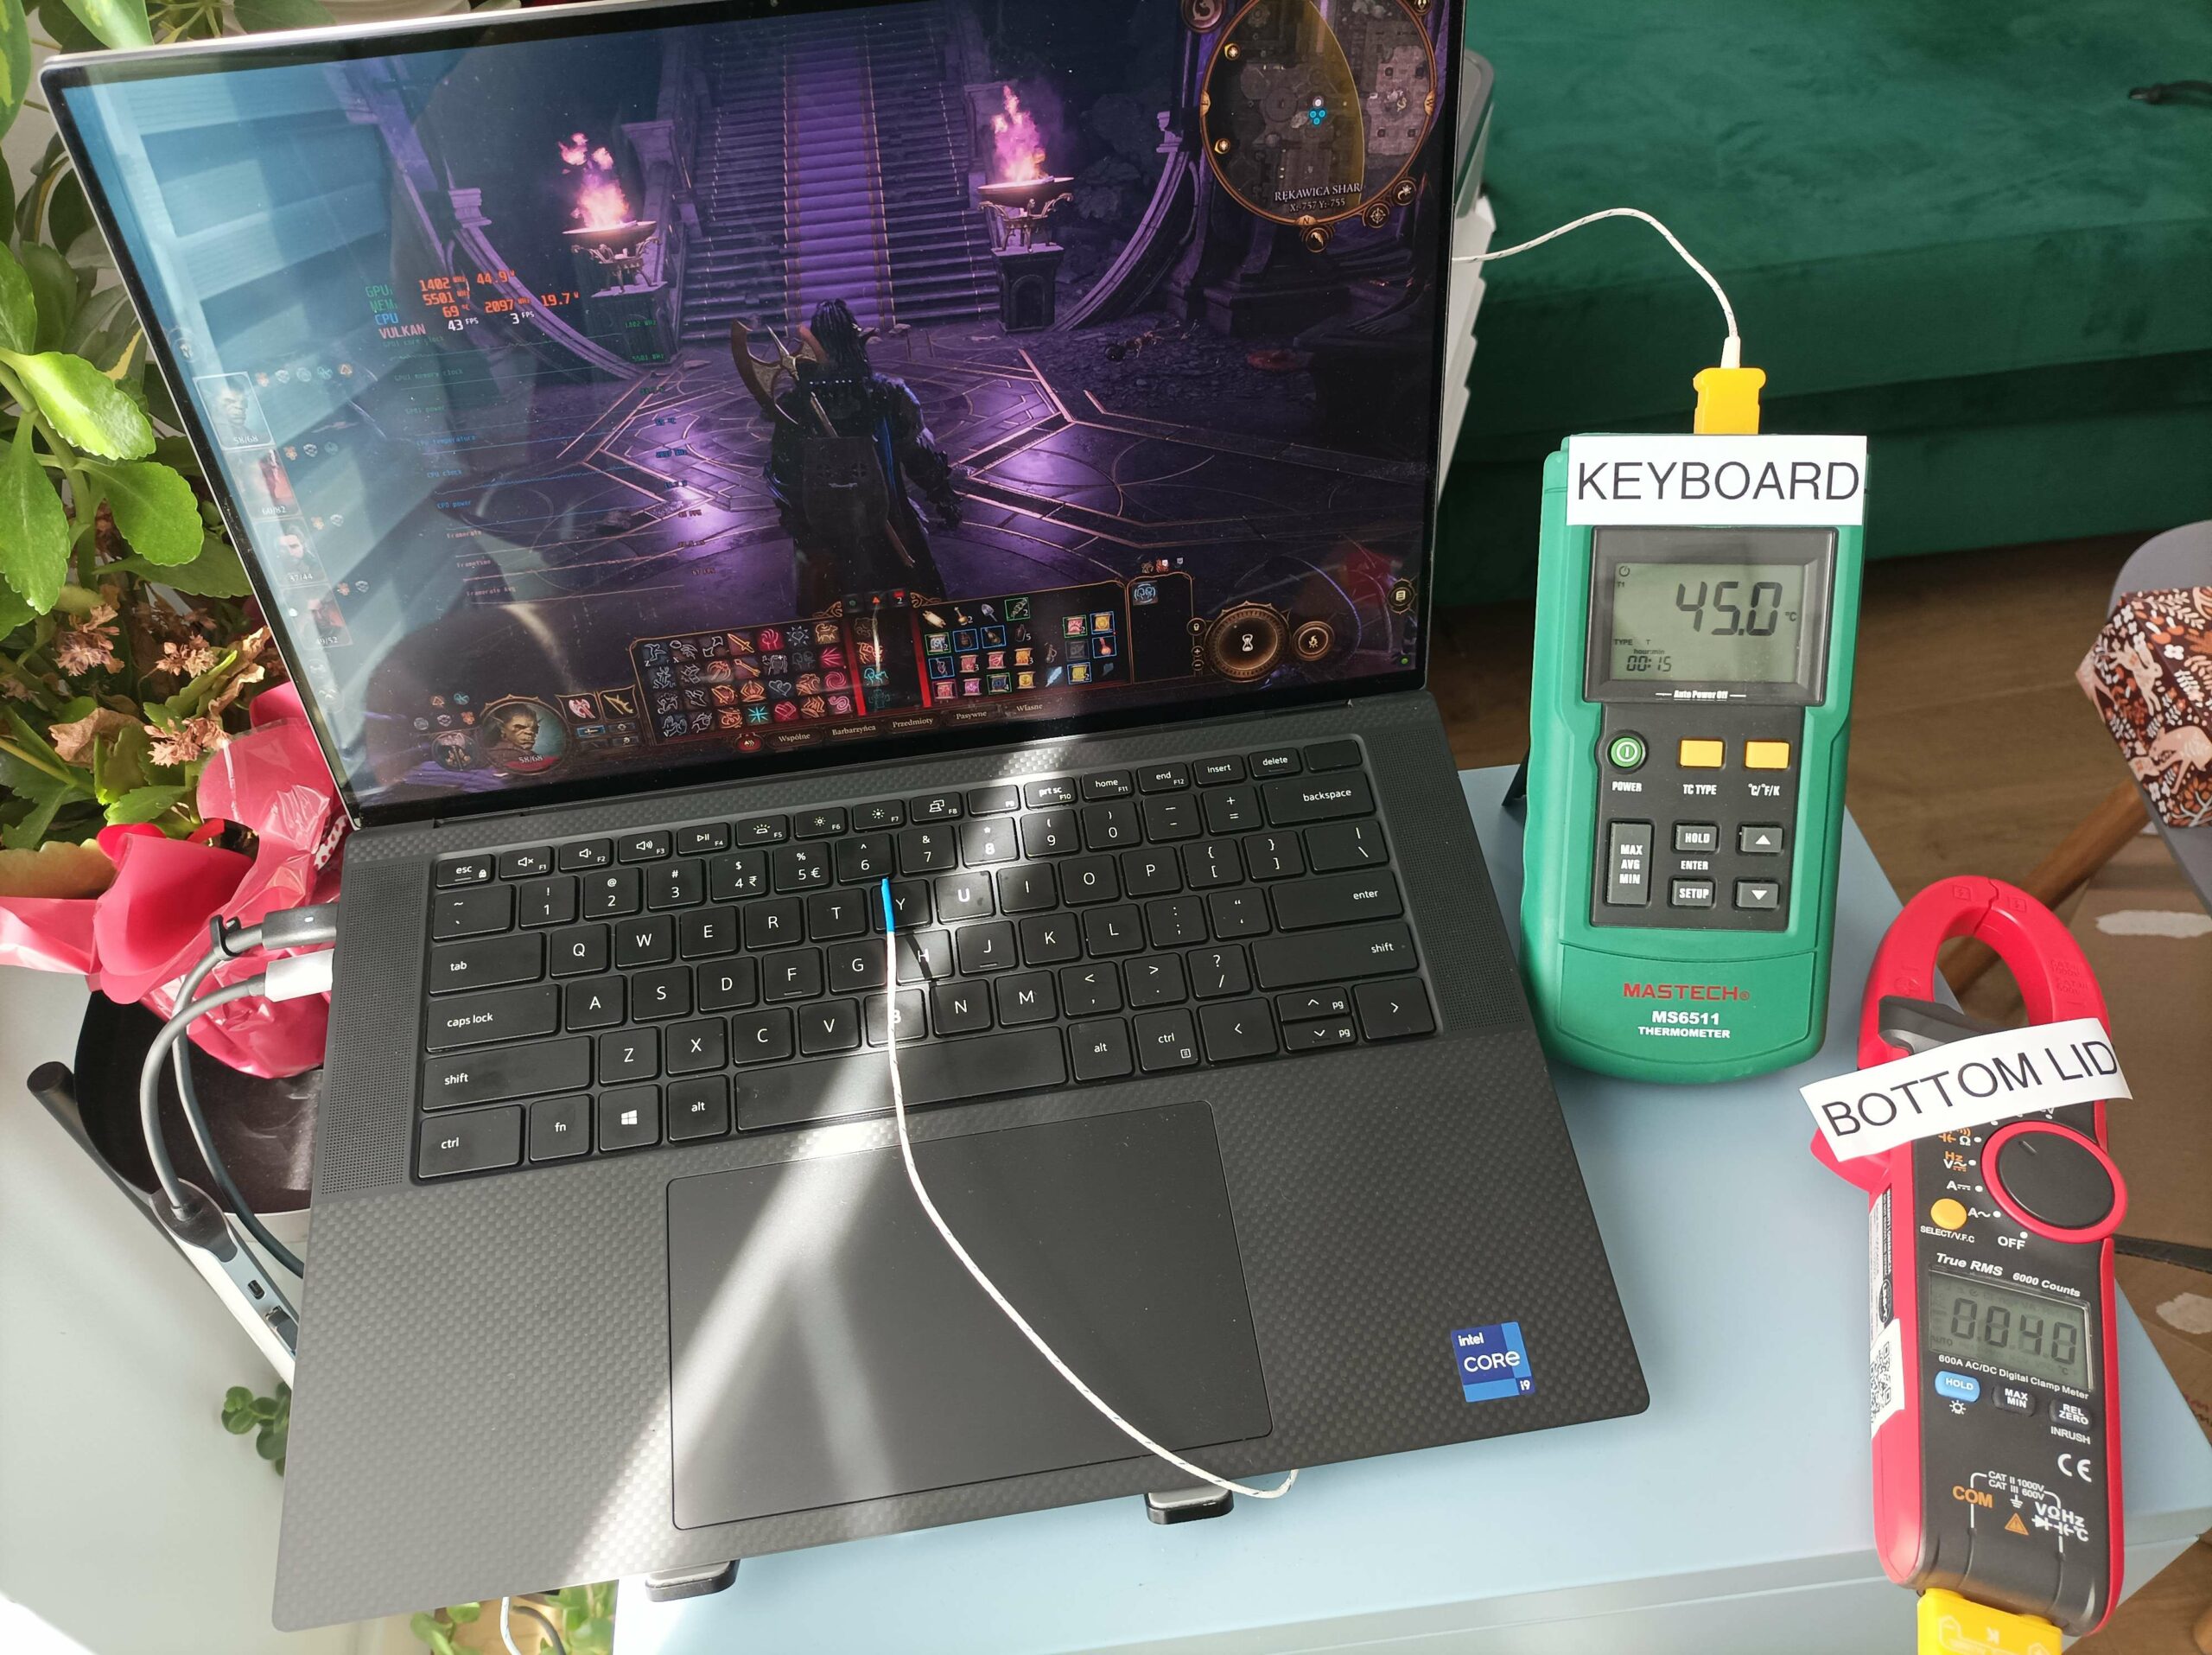
One for the keyboard under the key with number 6.
One for the lid was placed exactly like that. Photo taken from video recording that I will share later.
Benchmark Recordings
Before
https://www.youtube.com/watch?v=wtauM4jZPJk
After
https://www.youtube.com/watch?v=gpcVh3VLoKo
Links to products are refferal links with my Amazon Associate Program.